
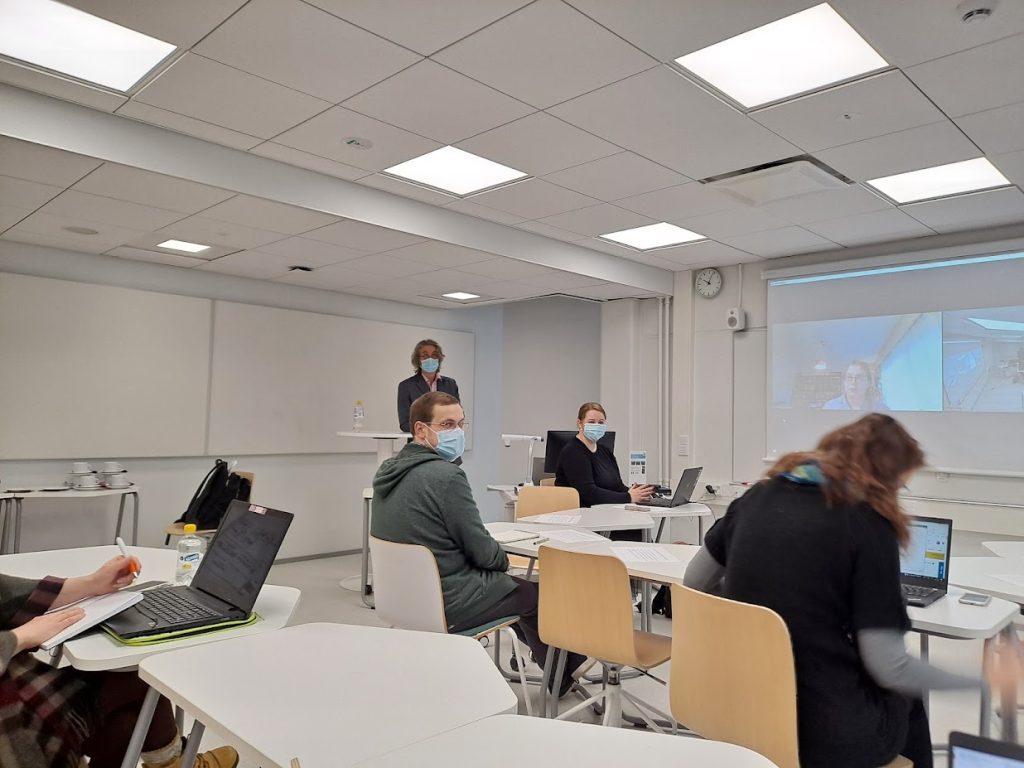
On Friday 26 November, the EModGraL research team and our key collaborators gathered together in wintry Turku (in person and via Zoom) to discuss the tentative typology of graphic devices we are developing for our materials.
There are several modern typologies used for graphic devices that offer a helpful starting point for us, but we have not yet found a classification that would be directly applicable to our early printed materials. We are therefore working on developing a typology for the purposes of the project. In the first stage, the typology will be rather simple, consisting of a few main categories that enable us, for example, to distinguish between diagrams, tables, and pictures. In the first stage of data collection, our research assistant will categorise graphic devices in our dataset according to this typology. In the next stage, we will develop a more nuanced categorisation of the data based on what we find in our materials.
Workshop sessions
Our workshop was organised as a one-day intensive event with three sessions focused on different aspects of the tentative typology. In the first session, we introduced the project and our data collection procedure. We also discussed the various categories we intend to exclude from our dataset. The second session focused on the categories of figures and tables, while the third session was concerned with ‘general images’ or pictures.
The discussion was lively throughout the day, and we received plenty of useful comments and feedback on our tentative typology. After the workshop, we had dinner together in the 17th-century cellars of a local restaurant.
Tricky cases
Our discussion was mainly based on samples of material from 1596 and 1696. The books from these years form the core of our pilot dataset, and we expect them to contain enough material to provide us with a workable initial categorisation.
While it has thus far been relatively easy to categorise most of the graphic devices in our data from the first pilot year, 1596, some cases have proved tricky. For example, while we exclude tables of contents from our quantitative dataset, what should we do with a table of contents that is organised as a horizontal tree diagram?1 In other words, when collecting data, should we prioritise function (a table of contents should be excluded) or form (a horizontal tree diagram should be included)? This question is at the core of many of the problematic cases we discussed in the workshop. There are no easy solutions, so we will have to find compromises that are good enough for the purposes of our project.
The data workshop took place at exactly the right time considering the timeline of the whole project. We expect that our tentative typology will change and develop during the project, but it was very useful to compare notes at this early stage to ensure that our data collection procedure is feasible and that the tentative categories are helpful in terms of the later stages of the project. We are grateful for the expert advice and insightful comments provided by our collaborators!
Mari-Liisa Varila | Twitter: @mlvarila