Classifying early modern graphic devices

We are delighted to announce the publication of our team-authored article “Developing a classification model for graphic devices in early printed books” published in Studia Neophilologica (open access, online, ahead of print).

In the article, we discuss our methodology and introduce our model for classifying graphic devices in historical materials. This classification is the foundation for our ongoing quantitative survey of the use of graphic devices in early modern books.

We also discuss previous taxonomies and models which have been presented for classifying graphic elements in various fields, ranging from geography to semiotics and education psychology, for example. We explain why none of these existing models is suitable for our EEBO and ECCO materials, and what steps we have taken to devise our own classification model.

A diagram showing the classification model of the Early Modern Graphic Literacies project. Graphic devices are divided into four main categories: General image; Diagram; Table; and Unclear. Each main category is divided into subcategories. General images are classified into general images and general images which contain text. Diagrams are classified into Diagrams, Arithmetic notation, Braces, and Musical notation. Tables are classified according to their size: large, medium, and small. Tables have a separate subcategory for calendars. Unclear items have one subcategory: Unclear tables.
The EModGraL classification model. Visualisation: MLV/EModGraL

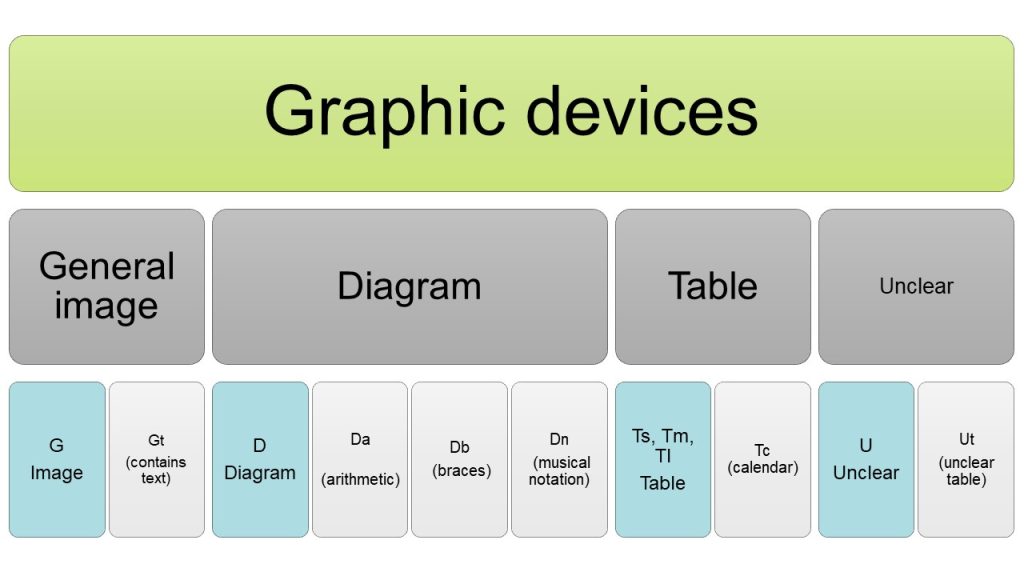
In short, we divide graphic devices in three main categories: general images (G), diagrams (D), and tables (T). All categories have subcategories for certain distinctive types, such as calendars (Tc) and musical notation (Dn). Additionally, any unclear items (unclear due to reasons of damage, or because they combine characteristics of more than one category, for example) are placed in a separate category (U). Tagging unclear items separately allows us to exclude them from the quantitative analyses while keeping them easily accessible for further examination in qualitative research articles.

Ruokkeinen, Sirkku, Aino Liira, Mari-Liisa Varila, Otso Norblad, and Matti Peikola. “Developing a Classification Model for Graphic Devices in Early Printed Books.” Studia Neophilologica, 2023. https://doi.org/10.1080/00393274.2023.2265985.

twitter Follow us on Twitter!

Facebooktwitterredditpinterestlinkedinmail

Data workshop 26 November

On Friday 26 November, the EModGraL research team and our key collaborators gathered together in wintry Turku (in person and via Zoom) to discuss the tentative typology of graphic devices we are developing for our materials.

There are several modern typologies used for graphic devices that offer a helpful starting point for us, but we have not yet found a classification that would be directly applicable to our early printed materials. We are therefore working on developing a typology for the purposes of the project. In the first stage, the typology will be rather simple, consisting of a few main categories that enable us, for example, to distinguish between diagrams, tables, and pictures. In the first stage of data collection, our research assistant will categorise graphic devices in our dataset according to this typology. In the next stage, we will develop a more nuanced categorisation of the data based on what we find in our materials.  

The image shows participants of the data workshop in a classroom, with two participants on the screen.
The workshop begins. Photo: Outi Merisalo

Workshop sessions

Our workshop was organised as a one-day intensive event with three sessions focused on different aspects of the tentative typology. In the first session, we introduced the project and our data collection procedure. We also discussed the various categories we intend to exclude from our dataset. The second session focused on the categories of figures and tables, while the third session was concerned with ‘general images’ or pictures.

The discussion was lively throughout the day, and we received plenty of useful comments and feedback on our tentative typology. After the workshop, we had dinner together in the 17th-century cellars of a local restaurant.

Tricky cases

Our discussion was mainly based on samples of material from 1596 and 1696. The books from these years form the core of our pilot dataset, and we expect them to contain enough material to provide us with a workable initial categorisation.

While it has thus far been relatively easy to categorise most of the graphic devices in our data from the first pilot year, 1596, some cases have proved tricky. For example, while we exclude tables of contents from our quantitative dataset, what should we do with a table of contents that is organised as a horizontal tree diagram?1 In other words, when collecting data, should we prioritise function (a table of contents should be excluded) or form (a horizontal tree diagram should be included)? This question is at the core of many of the problematic cases we discussed in the workshop. There are no easy solutions, so we will have to find compromises that are good enough for the purposes of our project.

The data workshop took place at exactly the right time considering the timeline of the whole project. We expect that our tentative typology will change and develop during the project, but it was very useful to compare notes at this early stage to ensure that our data collection procedure is feasible and that the tentative categories are helpful in terms of the later stages of the project. We are grateful for the expert advice and insightful comments provided by our collaborators!

Mari-Liisa Varila | Twitter: @mlvarila

twitter Follow us on Twitter!

Facebooktwitterredditpinterestlinkedinmail
1. See Ayelet Even-Ezra 2020, Lines of Thought: Branching Diagrams and the Medieval Mind. Chicago: U of Chicago Press.