Graphic devices in English incunabula

In this blog post, Mari-Liisa Varila recounts the results of our initial survey of graphic devices. Conducted on English incunabula, this survey served as the basis of the project’s data collection principles.

In the Early Modern Graphic Literacies project, we record the use of graphic devices, primarily images, diagrams, and tables, and classify them either according to this division – or where necessary – as ‘uncertain’, to create a record of the use of graphic devices in early modern England. Most of our data are collected from specific sample years at a range of 25 years. Our methods are described further in Ruokkeinen et al 2023. However, for incunabula, we examined all books in English available on EEBO from the 1470s to 1500. Investigating the incunabula was my responsibility, and this blog post discusses some of the observations I made during my data collection process. Although the results will probably not surprise anyone who has worked extensively on the earliest English printed books, this survey forms a backdrop for our findings from the later centuries.

There were altogether 185 incunabula included in our analysis; of the ca. 250 books on EEBO identified as incunabula in English, we excluded fragments, duplicates, and some items tagged ‘English’ that were in Latin. I went through the image sets of these books on EEBO, looking for illustrations, tables, and diagrams. Following the EModGraL approach, I did not take into account images that have a specific marketing or decorative function (such as images on title-pages, frontispieces, printers’ devices, or ornaments). This analysis also excludes paratextual devices such as tables of contents.

A majority of the incunabula have no images at all. Where images are found, they are typically illustrations with no captions or caption-like elements – text that would identify or describe the contents of the illustration and that would typically be set apart from the body text. However, there are also some illustrations that are equipped with captions. Some incunabula only contain a few illustrations, while others – for instance the Canterbury Tales (STC 5083) and the Legenda aurea (STC 24873) – make frequent use of them.

There are no images that clearly fulfil all of our present-day criteria for tables, but there are several instances of table-like elements or, as we call them in the project ‘unclear tables’. Some of these will be discussed in a separate study (Liira & Scase, in prep.). There are also a few other graphic devices that are difficult to classify, for instance the medallion-within-a-square designs in the ‘St Albans Chronicle’, STC 9995 (a later example of such a device is shown in Ruokkeinen et al., Figure 8).

Regarding the use of diagrams or diagram-like images, two works stand out from the rest. The first one of these is William Caxton’s Mirror of the World (STC 24762, 1481). This edition is exceptional in its use of not only images, but also many diagrammatic illustrations, missing from nearly every other incunable. Caxton’s illustrations draw on the French manuscript tradition. A digitized copy of the edition can be consulted for instance on the Library of Congress website here. In a copy of the later edition (1489) currently in Glasgow University Library (Sp Coll Hunterian Bv.2.30), a reader has contributed to the illustrations by annotating the world map.

Another intriguing book in terms of its image types is Wynkyn de Worde’s second edition of the compilation known as the Book of Saint Albans (STC 3309, 1496). This work contains some illustrations that might be described as diagrammatic to a degree. In the section on fishing, there are images of different kinds of instruments and fishing lines, and these are equipped with explanatory captions (e.g. “The lyne for a pyke”, H4r). Although these images are in our classification placed under ‘General image’, their practical function calls to mind later, more complex technical diagrams.

Of course, the scarcity of tables and diagrams in the earliest English printed books does not mean that such devices did not exist yet. On the contrary, there are various kinds of tabular and diagrammatic devices already in medieval (and earlier) manuscripts. In Peikola & Varila 2024, recently introduced in this blog, we examine the various ways in which medieval text producers instructed their readers in understanding and using the devices. The lack of tabular and diagrammatic elements in late fifteenth-century English printed books may partly be a result of the economic and technical constraints of early printing. During this period, printers in England were still experimenting with the potential of the new technology while also employing previously conventionalised ways of presenting text on the page. Images (woodblocks) had to be prepared separately from the text (type), and it is possible that the costs of commissioning images were easier to justify for narrative texts containing enticing illustrations rather than for practical books with diagrams. Perhaps illustrations were also slightly easier to reuse in editions of other works than diagrams created for a very specific purpose. As for tables, they could in theory be laid out simply by setting the type into a grid formed by rows, columns, and blank space. Although there are no tables in the incunabula that would adhere to a strict modern definition of ‘table’ (typically a ruled grid with labelled rows and/or columns), there is still evidence of tabular formatting in these early books, perhaps most commonly in different kinds of lists as well as paratextual elements such as tables of contents and indices.

Mari-Liisa Varila

twitter Follow us on Twitter!

Facebooktwitterredditpinterestlinkedinmail

Presenting manuscript tables and diagrams

Matti Peikola and Mari-Liisa Varila on the metadiscourse of graphic devices.

Our article examines how tables, diagrams and other graphic devices were made accessible to readers of Middle English texts from the late 14th to the early 16th century. We focus on metadiscourse employed by text producers to identify and describe graphic devices and to guide readers in using them. Such material is found in short descriptive text elements like titles, rubrics and headings, as well as in longer instructive items such as rules and canons, primarily in the domains of science and religion. The material context of the book also features in our analysis, as we discuss visual and spatial relationships between the graphic device and related metadiscourse on the manuscript page.

In the article, we argue that Middle English metadiscourse about graphic devices may be compared functionally to the work performed by (extended) captions in present-day data visualisations for example in science text books. The high degree of reader engagement and detailed procedural instructions sometimes present in the data suggest that graphic literacy competences of the intended vernacular readership might not always have been very high. Evaluative strategies sometimes used by text producers might indicate that some readers had to be persuaded about the efficacy of graphic devices. Scrutinising the relationship between graphic devices and metadiscourse associated with them opens up fundamental questions about the primacy of text versus image and discourse versus metadiscourse. In the framework of the EModGraL project, our article provides a helpful precursor to our examination of similar phenomena in early printed books.

Peikola Matti & Mari-Liisa Varila 2024. Presenting manuscript tables and diagrams to the Middle English reader. Journal of Historical Pragmatics. https://doi.org/10.1075/jhp.22004.pei.

Matti Peikola

twitter Follow us on Twitter!

Facebooktwitterredditpinterestlinkedinmail

CfP2: Reading visual devices in early books

Conference in Turku, Finland / 22-24 May 2025

Visual or graphic devices, such as images, diagrams, charts and tables, often operate between visual and verbal modes to convey information. In books and documents these devices may be used, for example, to illustrate and expand upon the text, to support or distract from the message conveyed by the text, or to aid in the comprehension of complex concepts which would be difficult to express through words alone. Although graphic devices may also communicate through textual elements, their main communicative tools are structure, symbolism, and cultural imagery.

Our project organises an international conference on the study of visual and graphic devices in early books, documents and textual objects in Turku, Finland, 22-24 May 2025.

Keynote speakers:

  • Prof. Andrew M. Riggsby (University of Texas): “The Segmentation of Roman Documents”
  • Prof. Wendy Scase (University of Birmingham): “Thinking with Visual Devices in a Late Medieval Gentry Household”
  • Dr Carla Suhr (University of Helsinki): “The Lizard and the Rat: Images in Early English Printed Texts for Popular Audiences”

We invite contributions from book studies, philology and historical linguistics, textual scholarship, literary studies, history of science, art history, and other related fields, including interdisciplinary approaches. Our main focus is on the medieval and early modern periods.

We are interested in questions such as: how were graphic devices used, framed and understood? How were innovations and conventions of data visualization transmitted across texts and languages? How did the diachronic or geographical spread of graphic devices progress in different parts of the world?

Relevant topics and themes include:

  • Visual and graphic devices (e.g. images, tables, and diagrams) and their design and use (as part of text/supplementing text)
  • Emerging practices and changing conventions: aesthetics, design, technologies
  • Paratext and metatext: linguistic framing and presentation of graphic devices
  • Visualising knowledge and information
  • Different audiences, readers, and literacies: lay/professional, learned/vernacular
  • Use of graphic devices in different domains and genres: instructional and technical writing, literature, scientific writing, popular texts, religion
  • Medieval and early modern manuscripts and printed books, including various physical formats (also broadsheets, pamphlets, scrolls, letters), also early books from non-European regions and languages
  • Theoretical and methodological approaches to visual devices: opportunities and challenges (including digital humanities approaches)

Please send an abstract of c. 300 words to VisualBookConf@utu.fi by October 15, 2024. October 31, 2024.

Early Modern Graphic Literacies (EModGraL) is a four-year research project funded by the Research Council of Finland (2021–25) and based at the Department of English, University of Turku, Finland. The project maps the use of graphic devices in early English printed books to study the development of vernacular graphic literacies and early strategies of data visualization.

For more information, email us at VisualBookConf@utu.fi.

twitter Follow us on Twitter!

Facebooktwitterredditpinterestlinkedinmail

CfP1: Reading visual devices in early books

Conference in Turku, Finland / 22–24 May 2025

Visual or graphic devices, such as images, diagrams, charts and tables, often operate between visual and verbal modes to convey information. In books and documents these devices may be used, for example, to illustrate and expand upon the text, to support or distract from the message conveyed by the text, or to aid in the comprehension of complex concepts which would be difficult to express through words alone. Although graphic devices may also communicate through textual elements, their main communicative tools are structure, symbolism, and cultural imagery.

The Early Modern Graphic Literacies project organises an international conference on the study of visual and graphic devices in early books, documents and textual objects in Turku, Finland, 22–24 May 2025.

Keynote speakers:

  • Prof. Andrew M. Riggsby (University of Texas)
  • Prof. Wendy Scase (University of Birmingham)
  • Dr Carla Suhr (University of Helsinki)

We invite contributions from book studies, philology and historical linguistics, textual scholarship, literary studies, history of science, art history, and other related fields, including interdisciplinary approaches. Our main focus is on the medieval and early modern periods.

We are interested in questions such as: How were graphic devices used, framed, and understood? How were innovations and conventions of data visualization transmitted across texts and languages? How did graphic devices spread diachronically or geographically in different parts of the world?

Relevant topics and themes include:

  • Visual and graphic devices (e.g. images, tables, and diagrams) and their design and use (as part of text/supplementing text)
  • Emerging practices and changing conventions: aesthetics, design, technologies
  • Paratext and metatext: linguistic framing and presentation of graphic devices
  • Visualising knowledge and information
  • Different audiences, readers, and literacies: lay/professional, learned/vernacular
  • Use of graphic devices in various domains and genres: instructional and technical writing, literature, scientific writing, popular texts, religion
  • Medieval and early modern manuscripts and printed books, including various physical formats (also broadsheets, pamphlets, scrolls, letters and other documents), also early books from non-European regions and languages
  • Theoretical and methodological approaches to visual devices: opportunities and challenges (including digital humanities approaches)

Please send an abstract of c. 300 words to VisualBookConf@utu.fi by October 15, 2024.

Please note that due to a scheduling clash, the conference takes place one week later than was previously announced.

For more information, please email us at VisualBookConf@utu.fi.

Best wishes,

Early Modern Graphic Literacies Project

Matti Peikola, Mari-Liisa Varila, Aino Liira & Sirkku Ruokkeinen

twitter Follow us on Twitter!

Facebooktwitterredditpinterestlinkedinmail

Project news!

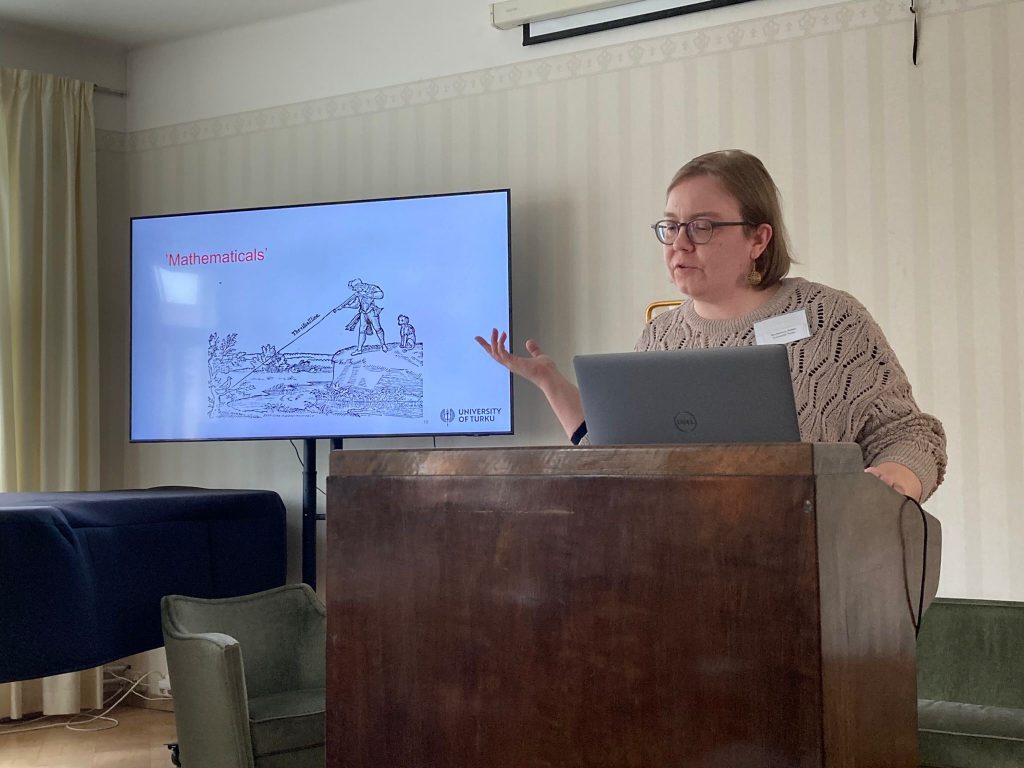
As an EModGraL post-doc, I have lately been working on research into the visual devices of English sixteenth-century military manuals. I am interested in the information transmission devices of these works, the arrival of different types of visual tools to the English print, and the availability of these visuals to the English readership. The material is very fruitful, and during the last few months, while working on an article on the topic, I have published a blog post and held several talks on the various side tracks the materials inspired.

The blog post, titled Renaissance diagrammatics and the English Tartaglia, was published in Ramus Virens, a medieval studies blog of University of Jyväskylä. In the blog, I explore the practices of reproduction of Tartaglia’s image-diagrams in the 1588 English translation, focusing especially on the copying of the diagrammatic sections of the diagram-images.

Speaking at the Humboldt Kolleg in Helsinki, May 15, 2024.

In March, I spoke at the Humboldt Kolleg, an event intended for the dissemination of information across disciplines organized by Alexander-von-Humboldt-Club Finnland. The presentation, titled “Graphicacy and the Military Revolution in sixteenth-century England” discussed the influence – or the lack thereof – of the military revolution on the practices of military publishing in sixteenth-century England.

Text: Sirkku Ruokkeinen | Photo: Antti Ijäs

twitter Follow us on Twitter!

Facebooktwitterredditpinterestlinkedinmail

Save the date!

Reading visual devices in early books, Turku, Finland / 22-24 May 2025

The EModGraL project organises an international conference on the study of visual/graphic devices in late medieval and early modern books in May 2025.

For more information, please visit our Conference page.

twitter Follow us on Twitter!

Facebooktwitterredditpinterestlinkedinmail

Workshop II

Almost exactly two years since the first EModGraL workshop it was time for the research team and our collaborators to gather again in Turku for a second full-day workshop, which took place in the newly renovated Arcanum building (and on Zoom) on Friday 3 November. The day was full of invigorating discussions on different kinds of graphic devices and their research.

We followed the 3-session format established in the first workshop. The first session was devoted to questions related to data. We discussed the EModGraL data gathering process and our finalised typology for classifying graphic devices, recently published. The second important topic to discuss was the challenge of combining our data collected from the two databases, EEBO and ECCO, as each database provides a slightly different set of metadata with which we operate. Thirdly, as we are planning to open our research data for other researchers after the project, we discussed some of the practical, legal and ethical questions that need to be taken into account. 

Photo of the workshop participants gathered around a table in the meeting room Luoma in Arcanum.
Workshop participants in the meeting room ‘Luoma’ in Arcanum.

The second session after lunch was reserved for discussing draft versions of two in-progress research articles. Aino Liira and Wendy Scase presented their draft of an article on metatext concerning tabular displays. Sirkku Ruokkeinen and Outi Merisalo presented their work on graphic devices and typographical practices in early modern English military manuals.

In the third session, Matti Peikola (et al.) and Mari-Liisa Varila presented on-going research, after which some time was reserved for general matters and wrapping any loose ends. In practice, these two halves of the session were somewhat intertwined and discussion remained lively until the end.

Our final, important topic to discuss was the graphic literacies conference we’re planning for 2025. More information will follow shortly!

Text: Aino Liira | Photo: Janne Skaffari

twitter Follow us on Twitter!

Facebooktwitterredditpinterestlinkedinmail

Classifying early modern graphic devices

We are delighted to announce the publication of our team-authored article “Developing a classification model for graphic devices in early printed books” published in Studia Neophilologica (open access, online, ahead of print).

In the article, we discuss our methodology and introduce our model for classifying graphic devices in historical materials. This classification is the foundation for our ongoing quantitative survey of the use of graphic devices in early modern books.

We also discuss previous taxonomies and models which have been presented for classifying graphic elements in various fields, ranging from geography to semiotics and education psychology, for example. We explain why none of these existing models is suitable for our EEBO and ECCO materials, and what steps we have taken to devise our own classification model.

A diagram showing the classification model of the Early Modern Graphic Literacies project. Graphic devices are divided into four main categories: General image; Diagram; Table; and Unclear. Each main category is divided into subcategories. General images are classified into general images and general images which contain text. Diagrams are classified into Diagrams, Arithmetic notation, Braces, and Musical notation. Tables are classified according to their size: large, medium, and small. Tables have a separate subcategory for calendars. Unclear items have one subcategory: Unclear tables.
The EModGraL classification model. Visualisation: MLV/EModGraL

In short, we divide graphic devices in three main categories: general images (G), diagrams (D), and tables (T). All categories have subcategories for certain distinctive types, such as calendars (Tc) and musical notation (Dn). Additionally, any unclear items (unclear due to reasons of damage, or because they combine characteristics of more than one category, for example) are placed in a separate category (U). Tagging unclear items separately allows us to exclude them from the quantitative analyses while keeping them easily accessible for further examination in qualitative research articles.

Ruokkeinen, Sirkku, Aino Liira, Mari-Liisa Varila, Otso Norblad, and Matti Peikola. “Developing a Classification Model for Graphic Devices in Early Printed Books.” Studia Neophilologica, 2023. https://doi.org/10.1080/00393274.2023.2265985.

twitter Follow us on Twitter!

Facebooktwitterredditpinterestlinkedinmail

Grammar-writing as a thesis topic

A personal anecdote from a freshly graduated English major | Text: Elina Parkkila | Featured image: Debby Hudson (via Unsplash)

A well over a year ago, I was in the stage of my studies where it was time to prepare for the MA thesis. I was facing the same questions many students have at that moment. What is a good topic? Should my topic reflect on my future plans? What kind of topics interest me? Fortunately, I was lucky to stumble upon a topic that served to feed my two main interests in life, the English language and history.

Prior to my thesis seminar, I did a course called Late Modern English project. As the name suggests, it introduces students to the period of late modern English from the 18th to the beginning of the 20th century. I found the overall topic of the course interesting, but one portion of the material piqued my interest the most, grammar-writing. I decided to focus on this new topic I “discovered” for the essay-portion of the course. For my essay-writing, I picked a few 18th–century grammars and compared them to each other to see how they managed to cater to their audiences. In the essay, I made a small observation about how some of the grammars used what I referred to as “graphical content” and some did not. I constituted graphical content to be any form of break from traditional style of writing, which was supposed to be viewed visually through graphicacy rather than reading it as a text. Some examples of graphical content in 18th–century grammars were word lists, exercises, and atypical spacing of text. This observation was a blessing in disguise, as my course professor pointed out how this could be a possible thesis topic. I will not turn down a good suggestion, so I decided to venture further into the topic.

Graphical content in 18th-century grammars

For my MA thesis, I decided to analyse how different 18th–century grammars used graphical content for teaching grammar. I cross-referenced Eighteenth Century Grammars Online (ECEG) and Eighteenth-Century Collections Online (ECCO) for grammars that were written both by women and men. I was interested to see how the gender of the grammarian as well as the perceived target audience could influence the results. It led me down an interesting path to be educated on the overall history of grammar-writing in England, the history of grammarians, and the development of graphicacy.

Even to this day, almost a year after writing my thesis, I find the topic of grammar-writing highly intriguing. It was interesting to see how the societal changes and attitudes about people, the world, and languages were able to be seen in the grammars. As a woman, I was very intrigued by the research that had been done on female grammarians, who were slightly different in their approaches to teaching grammar compared to their male counterparts.

However, my analysis also proved my views to be slightly biased towards the growing demographic of female grammarians who mostly targeted their work towards women and children. Male grammarians, on the other hand, targeted their work more towards men and children. Before the proper analysis on my chosen grammars, I assumed that male grammarians were less inclined to use graphical content as a teaching tool, as their most common target demographic (men) were more likely to have received formal education on grammar. In a sense, I thought that the more educated the target demographic was, the less graphical content was used by grammarians. I proved myself wrong. Grammars targeted towards women contained the most graphical content, while grammars targeted towards men contained the second most amount of graphical content.

MA thesis writing is a multifaceted learning experience

As I am thinking about this learning experience a year later, it shows that I had a narrow view on who were a part of the new broader audiences for English grammars in the growing society of England. Sometimes checking your biases and learning from being wrong can open yourself up to an interesting analysis on how grammar-writing and teaching was viewed for different demographics.

Overall, I see the 18th–century grammars and grammar-writing as an interesting target of research, as the shifting economy and the rise of the working class created new avenues for writing and learning grammar. It makes one really think about the future of grammar-writing research, what kind of signs of our society today can be found in modern grammars?


The author is a former English student at the University of Turku. The history of the English language and history in general were the author’s key interests while studying. The author is currently working in the museum field.

Parkkila, Elina. 2022. The Beginning of Visual Grammar Learning: Analysis on the Use of Graphical Content in 18th Century English Grammars. Master’s Thesis, Department of English, University of Turku. Available online: https://urn.fi/URN:NBN:fi-fe2022091358943

twitter Follow us on Twitter!

Facebooktwitterredditpinterestlinkedinmail