North European Port Authorities’ Website Content and Usability Evaluation
Ms. Sari Kokkila, a student and a research assistant at the Turku School of Economics at the University of Turku, conducted a study under the title “North European Port Authorities’ Website Content and Usability Evaluation”. The study was also her master’s thesis and a part of the HAZARD publication series. The presentation of the study results and an award ceremony revealing the five best Port Authorities’ websites took place at the HAZARD Final Conference in Tallinn, 15 March 2019.
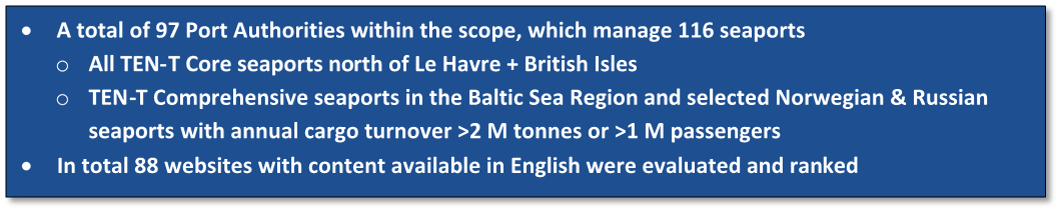
Websites are an important display window for any organisation. Hence, the websites of 97 main North European Port Authorities were evaluated in the end of 2018. The selection consisted of Trans European Transport Network (TEN-T) Core seaports north of Le Havre incl. the British Isles, and TEN-T Comprehensive seaports in the Baltic Sea Region (BSR) together with selected Norwegian & Russian seaports with over 2 million tonnes of cargo or over 1 million passengers annually.
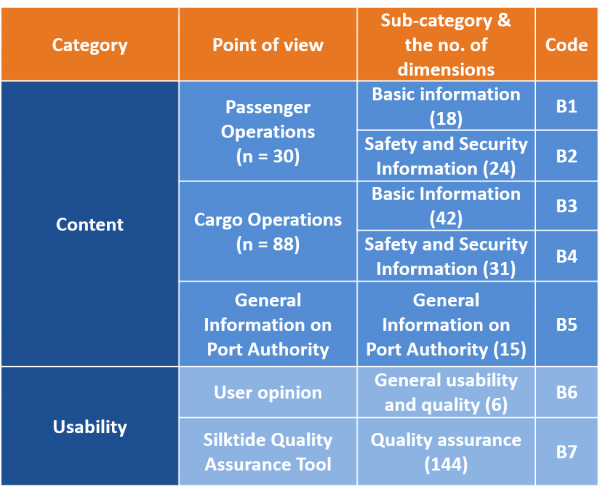
The evaluation focused on safety and security issues communicated via public websites of the Port Authorities, but also took into account general information about the Port Authority, alongside with evaluation of usability and quality of the websites. Each website available in English was assessed by at least two individual evaluators. In addition, website Quality Assurance tool Silktide was used to evaluate the technical performance of the websites.
The evaluation criteria were divided into two main Categories: Content and Usability sorted under seven (7) sub-categories. In total, the evaluation comprised 280 content, usability and website quality dimensions. The Overall Score was calculated as the average of the scores in every relevant sub-category, each on a scale from 0 to 100.
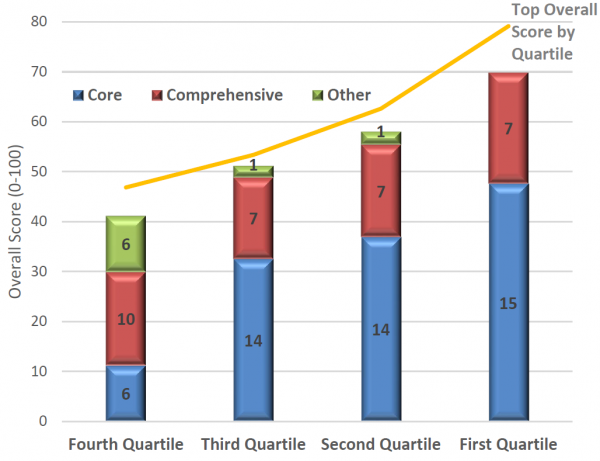
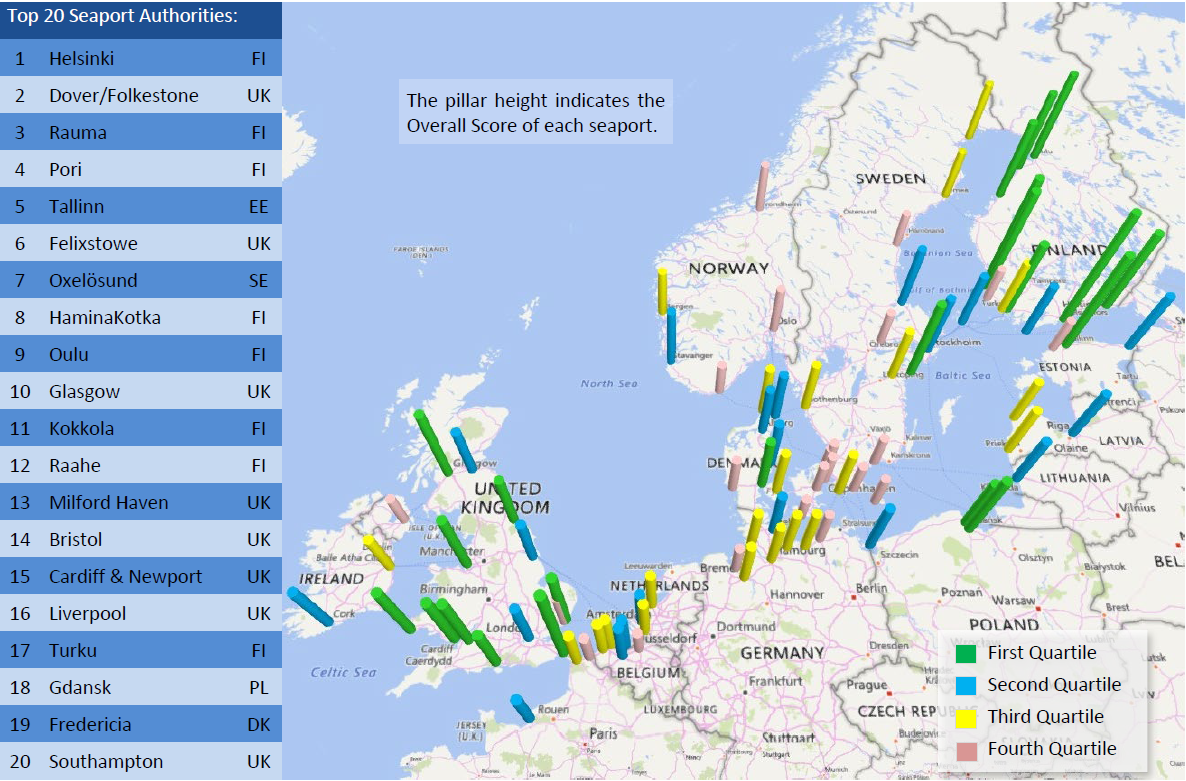
Port of Helsinki scored the highest followed by Port Authorities in Dover/Folkestone (2nd), Rauma (3rd and the best among Comprehensive ports), Pori (4th) and Tallinn (5th). 15 of the seaports in the 1st Quartile were Core seaports, while the 4th Quartile had only six. The distribution by type of seaport in the 2nd and 3rd Quartiles, respectively, was identical. The average Overall Score of 1st Quartile was almost 30 points higher than that in the 4th Quartile.
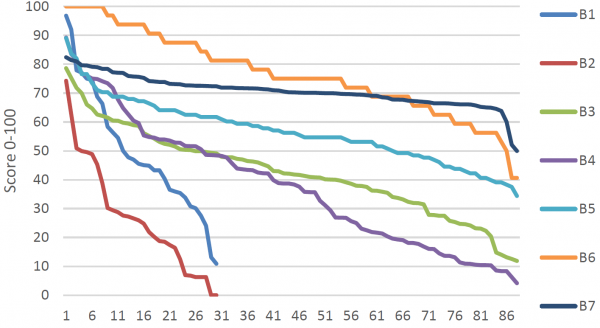
Websites, which performed well overall, tended to perform well also in all the sub-categories. Worryingly, however, the difference between top and bottom performance in the safety and security category (B2 & B4) was very high. By contrast, the technical performance level (B7) was rather uniform. Finnish and British Port Authorities dominated the Top 20 (FI 8, UK 8). Port of Tallinn (EE), Oxelösunds Hamn AB (SE), Fredericia of Associated Danish Ports A/S (DK) and Port of Gdansk Authority S. A. (PL) also made it to Top 20.
Of the Top 20 seaports, 13 were Core and seven Comprehensive TEN-T seaports. Only five passenger ports made the Top 20. However, the 1st (Helsinki) and 2nd (Dover) overall are also the two biggest passenger seaports in the scope. Top 20 seaports’ cargo volumes ranged from 2 to 50 million tonnes, typically with an annual volume less than 10 million tonnes. There was practically no correlation between the Overall Score and the size of the seaport.
More extensive results of the study including the full rankings can be found on the links below.
Leave a Reply